
SOL is trading precariously at $93 caught in the crossfire between two powerful market forces. The market is divided between two realities: Solana’s price is up 7% since Sunday fueled by strong demand for the ETF. However, volume is declining as it approaches psychological resistance at $100.
This is the definition of binary trading: either an institutional bid absorbs selling pressure and forces an exit, or a technical pattern triggers a trapdoor event. The entire setup now hinges on one question: can the bulls break above $100 before the bears grab the $85 neckline?
ETF FLOW UPDATE: Spot crypto ETFs recorded mixed flows last week.
• $BTC: +$767.33M
• $ETH: +$160.82M
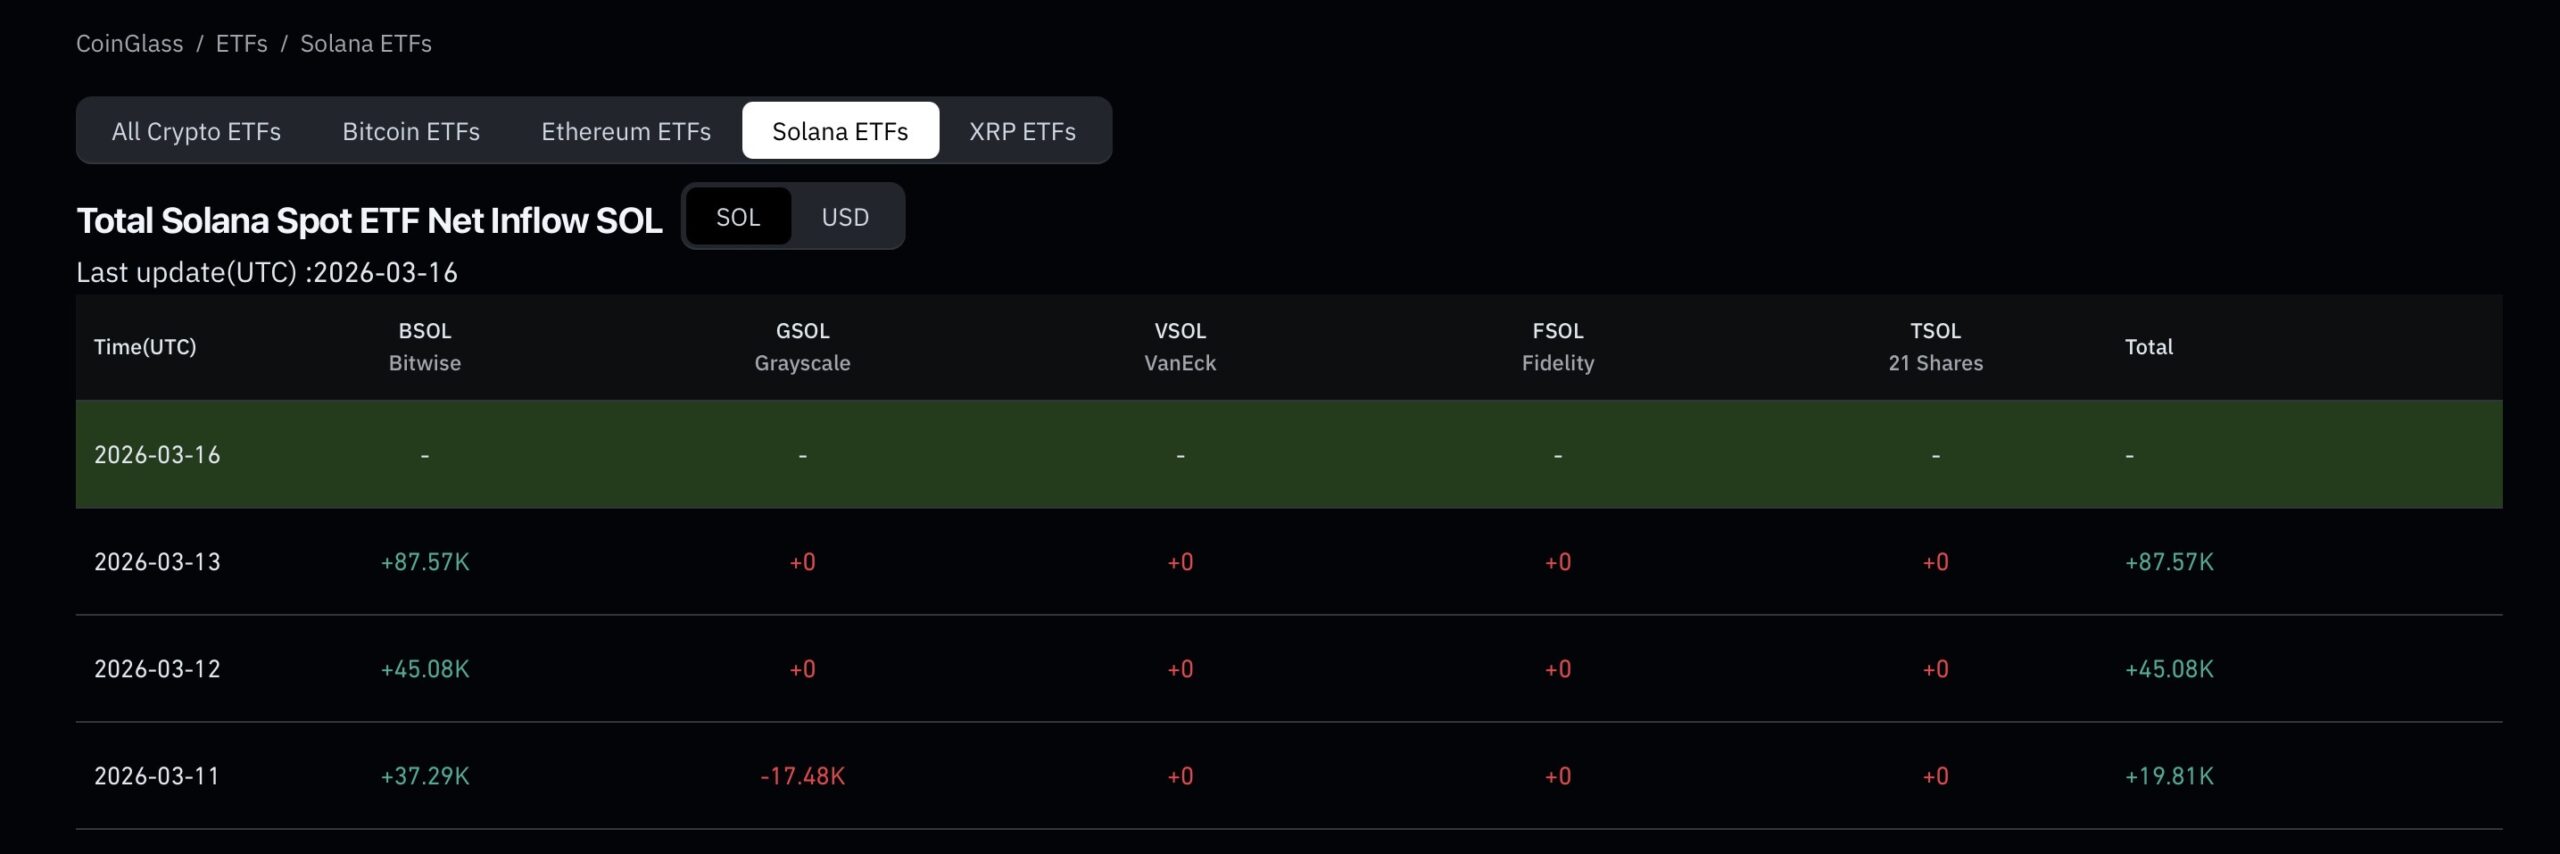
• $SOL: +$10.7M
• $XRP$28.07MInstitutional demand remains strong for BTC and ETH ETFs.
– Crypto Times (@CryptoTimes_io) March 16, 2026
GET: The Next 1000 Crypto Gem before It Lists on Exchange
Solana ETF Institutional Requirement: $10.7 million floor
If you look closely at the cash flow, Solana’s bull case seems obvious. While the shopkeepers were distracted, the institutional heavyweights were quietly collecting SOL at a furious pace. Last week alone, the Solana ETF saw a total inflow of $10.70 million, with a whopping $7.60 million entering the market on Friday alone. This brings the year-to-date revenue for Solana products to around $900 million, making it almost every other altcoin.
This strong buying pressure suggests that Solana’s recent price rise to $90 was no accident: it was backed by a smart investment in long-term holdings. This creates a “soft floor” under the price, making it difficult for the bears to push SOL below the $80s without significant volume.
However, there is an obvious contradiction here. With nearly $1 billion in institutional revenue this round, Solana should arguably be trading higher. The fact that the price is struggling to get to $100 despite this buying pressure means that someone else is selling on this strength. That “person” is probably the retail market, which is cooling fast.
FIND: The Best Crypto to Buy Now
Solana Price Analysis: Head and Shoulders Boss Fight
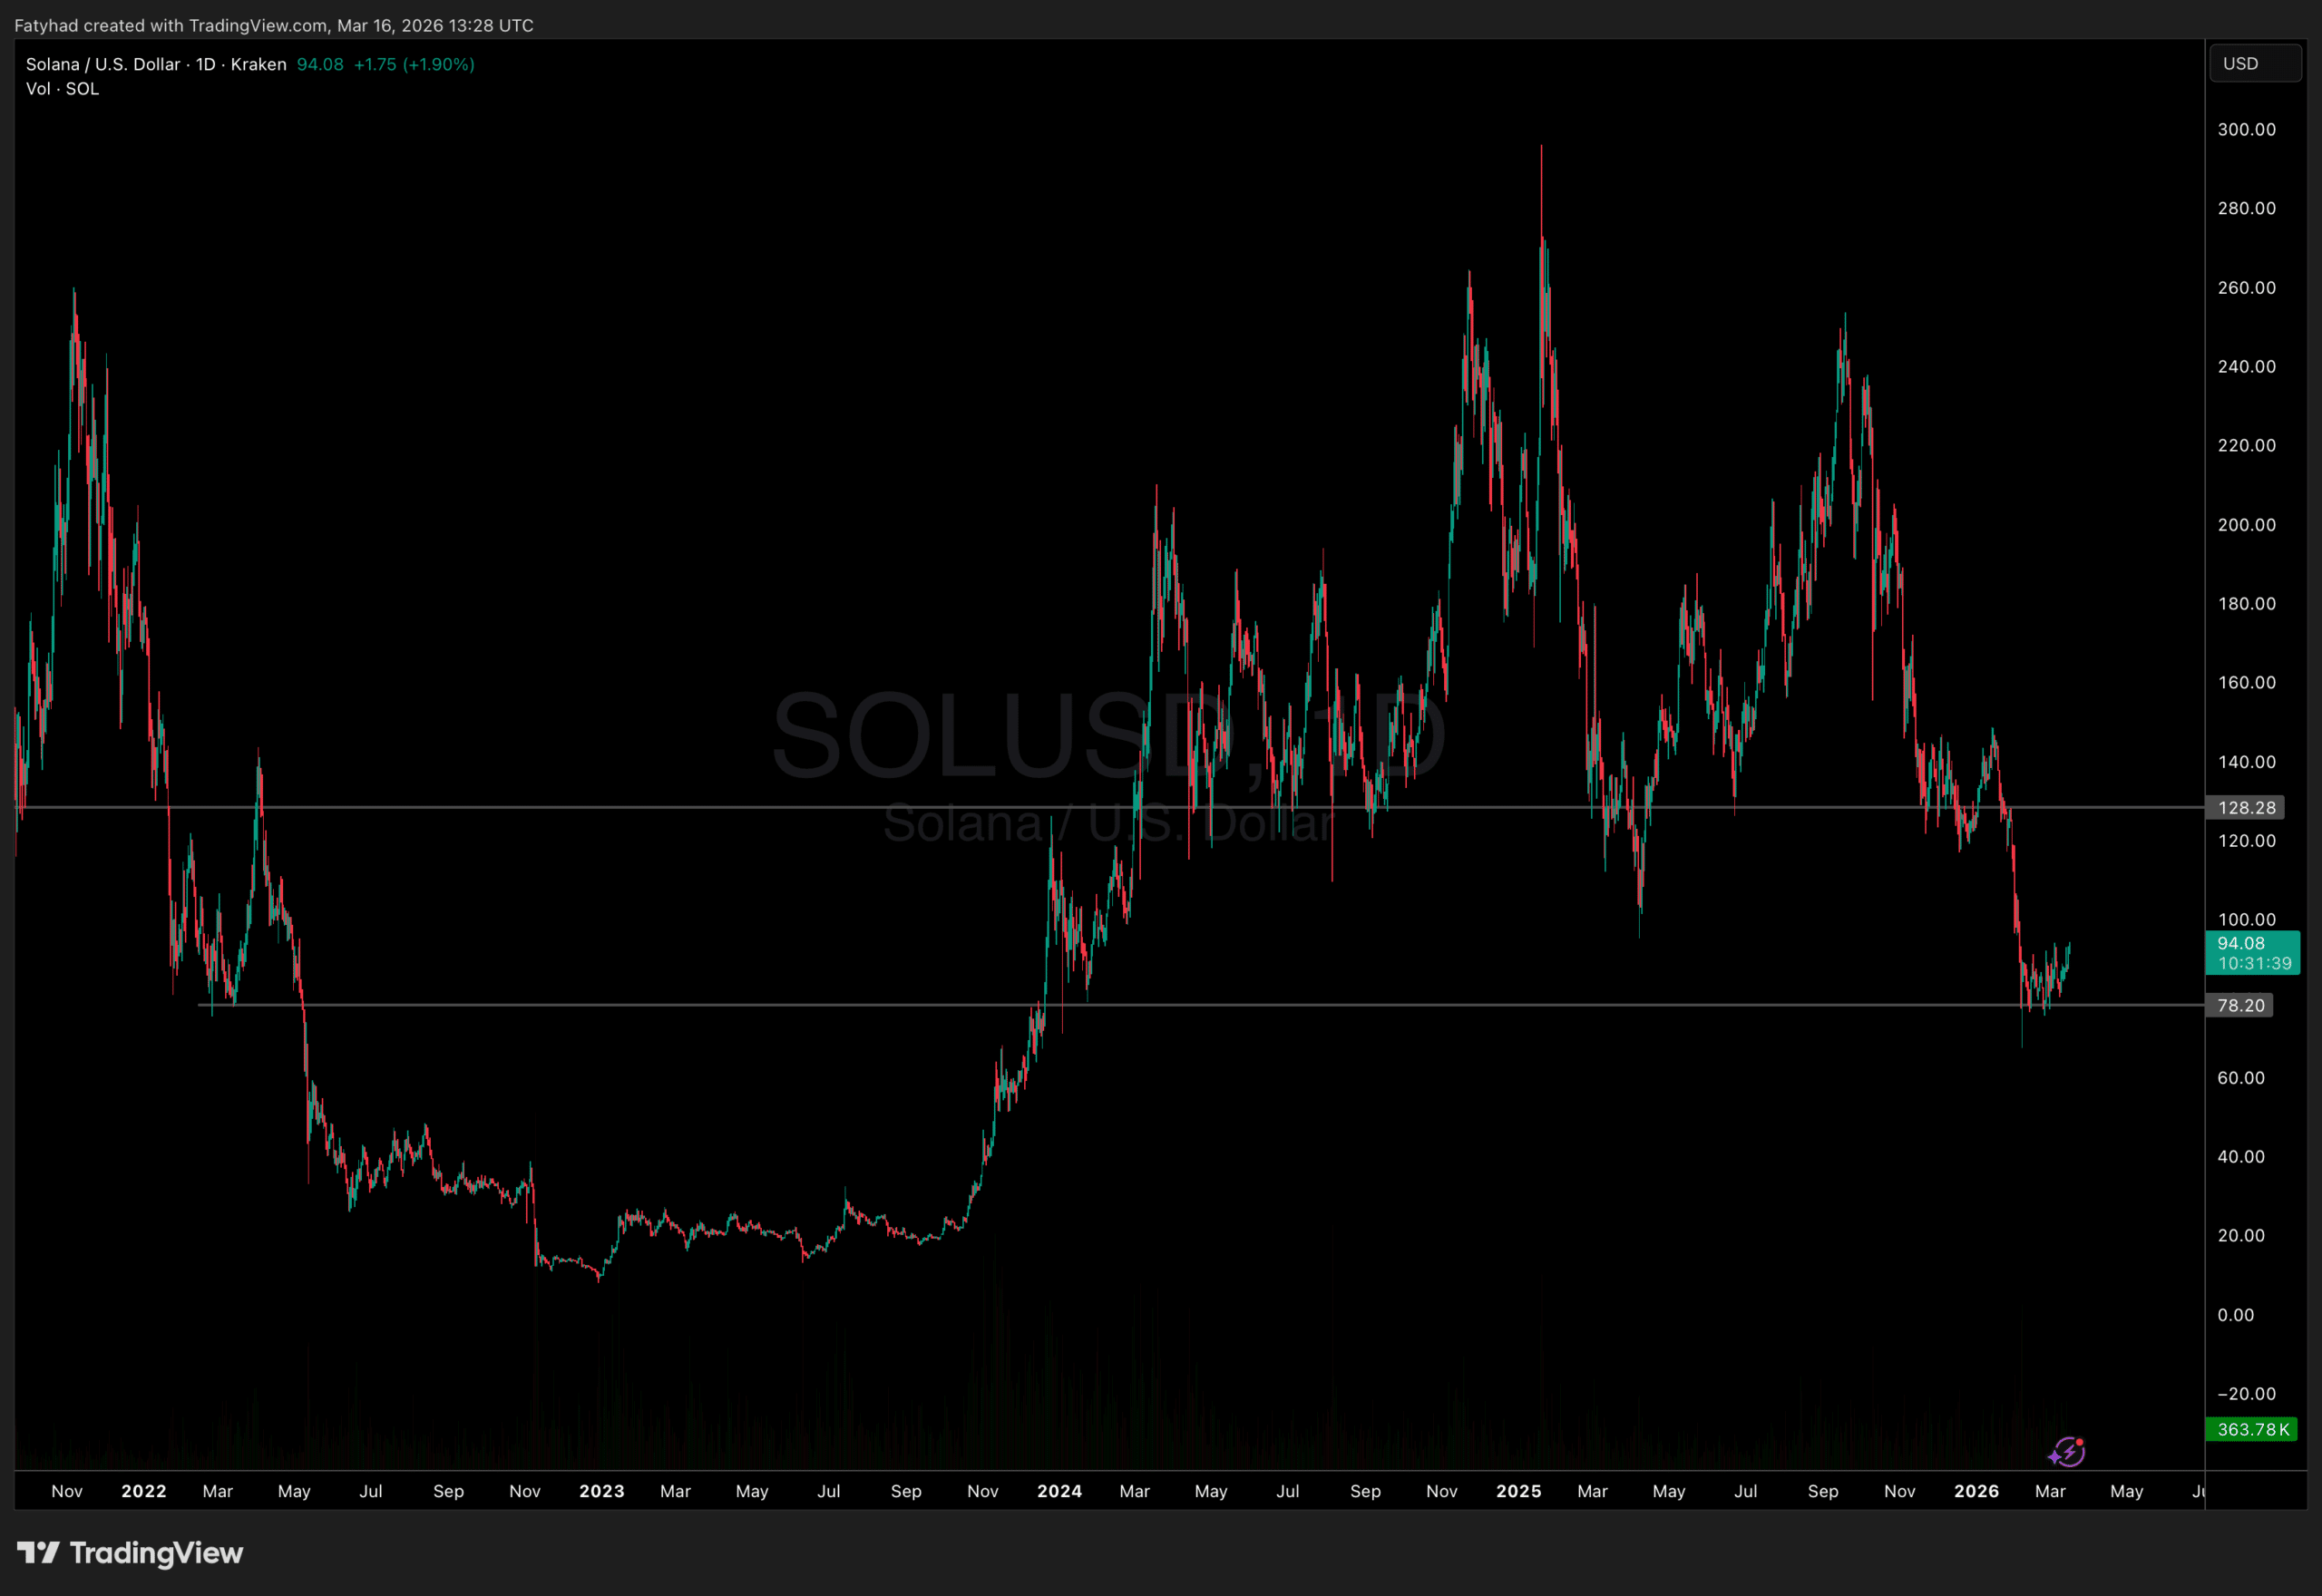
While the basic entry data is bullish, the chart screams caution. Solana is currently printing a potential head and shoulders pattern, a structure that usually marks the end of a bullish trend. Traders are looking for a “left shoulder” around $105 and a “head” at $126. The current price action around $93 forms the “right shoulder.”
The neckline sits between $80. If SOL fails to break above $100 and instead rolls to break below $80, the pattern is confirmed. The theoretical target for such a breakdown is the high of the pattern released from the neckline, which points to a brutal decline to $60 or even $55.
This pattern is why the $100 level is so important. A decisive daily close above $100 invalidates the right shoulder, destroys the bearish thesis, and is likely to trigger a short squeeze as bears scramble to cover. Until that happens, the threat of a reversal remains the dominant story on the chart.
FIND: Top Crypto Presales to watch now
Follow 99Bitcoins on X (Twitter) for Latest Market Updates and Subscribe on YouTube for Daily Expert Market Analysis.
The post Solana ETF Inflows Increase: Does SOL Finally Break $100? appeared first on 99Bitcoins.


